Dashboard
AgentSniff includes a web dashboard for real-time scan monitoring, history browsing, and settings management.
Starting the Dashboard
Features
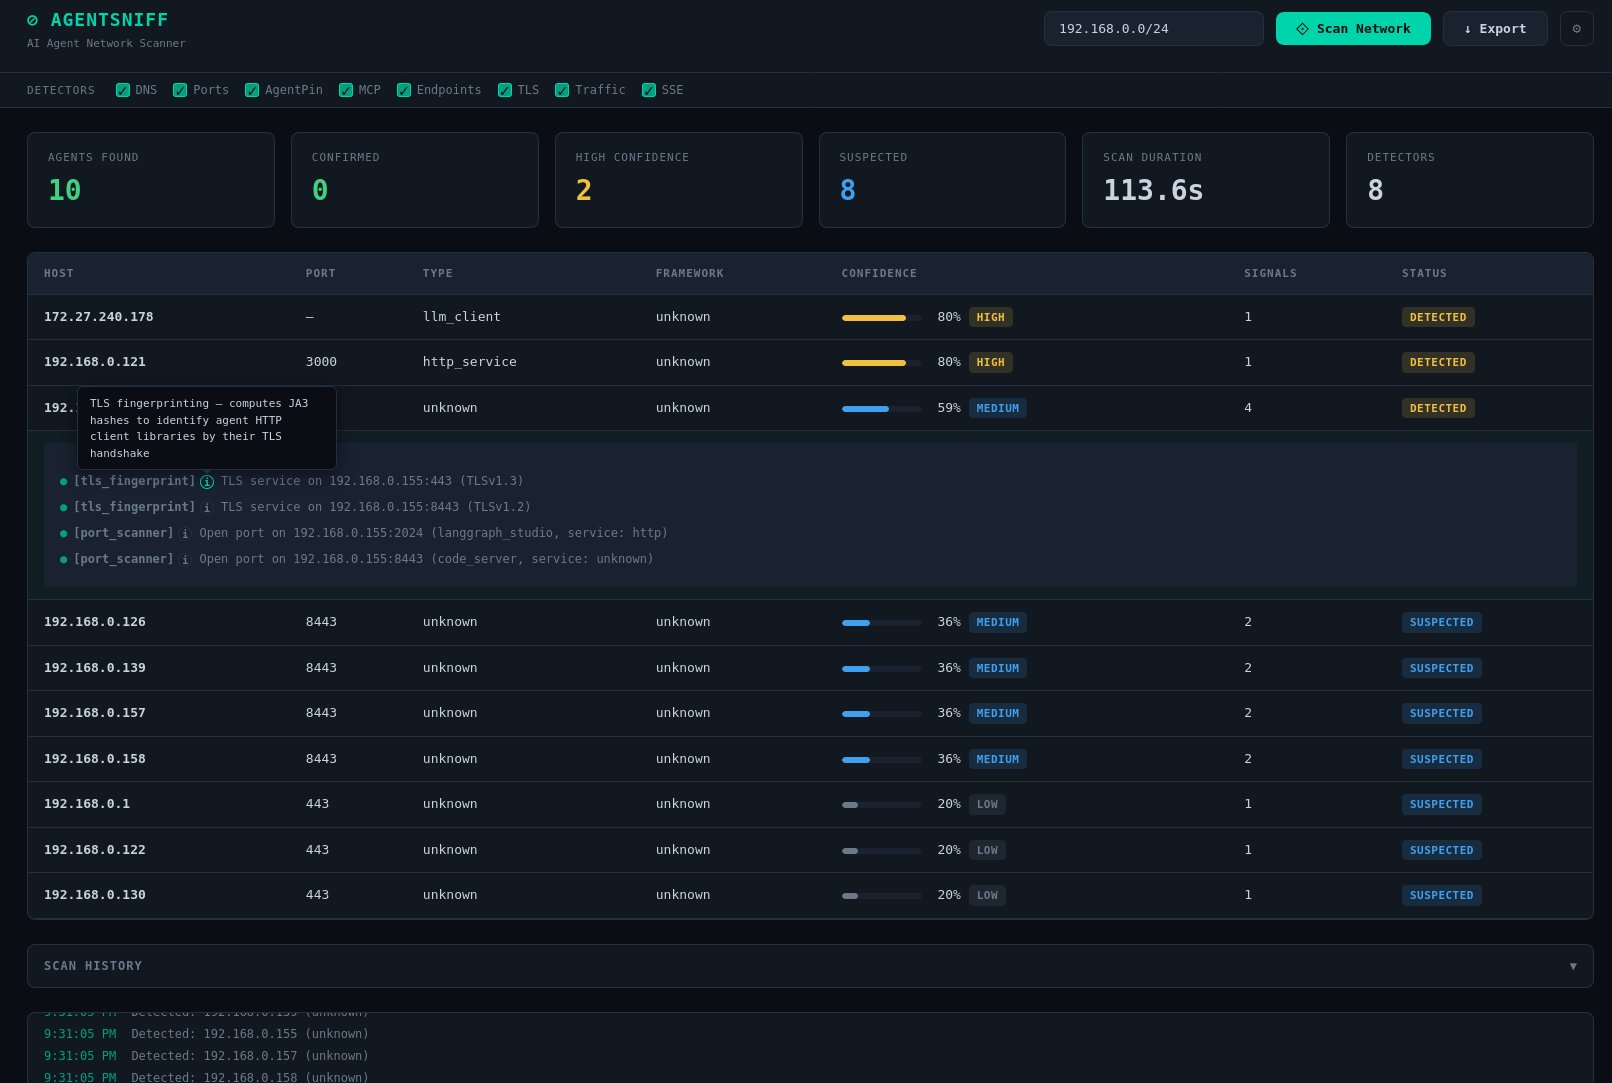
Live Scanning
- Select target network and detectors from the UI
- Real-time agent detection via Server-Sent Events (SSE)
- Confidence counters update as agents are found
- Stop button cancels the scan immediately
Scan Results
- Agents displayed with confidence level, framework, host, port, and signal count
- Expandable signal details for each detected agent
- Color-coded confidence levels: Confirmed, High, Medium, Low
Scan History
- Previous scans stored in SQLite database
- Browse past results with timestamps, agent counts, and status
- Cancelled and incomplete scans are preserved
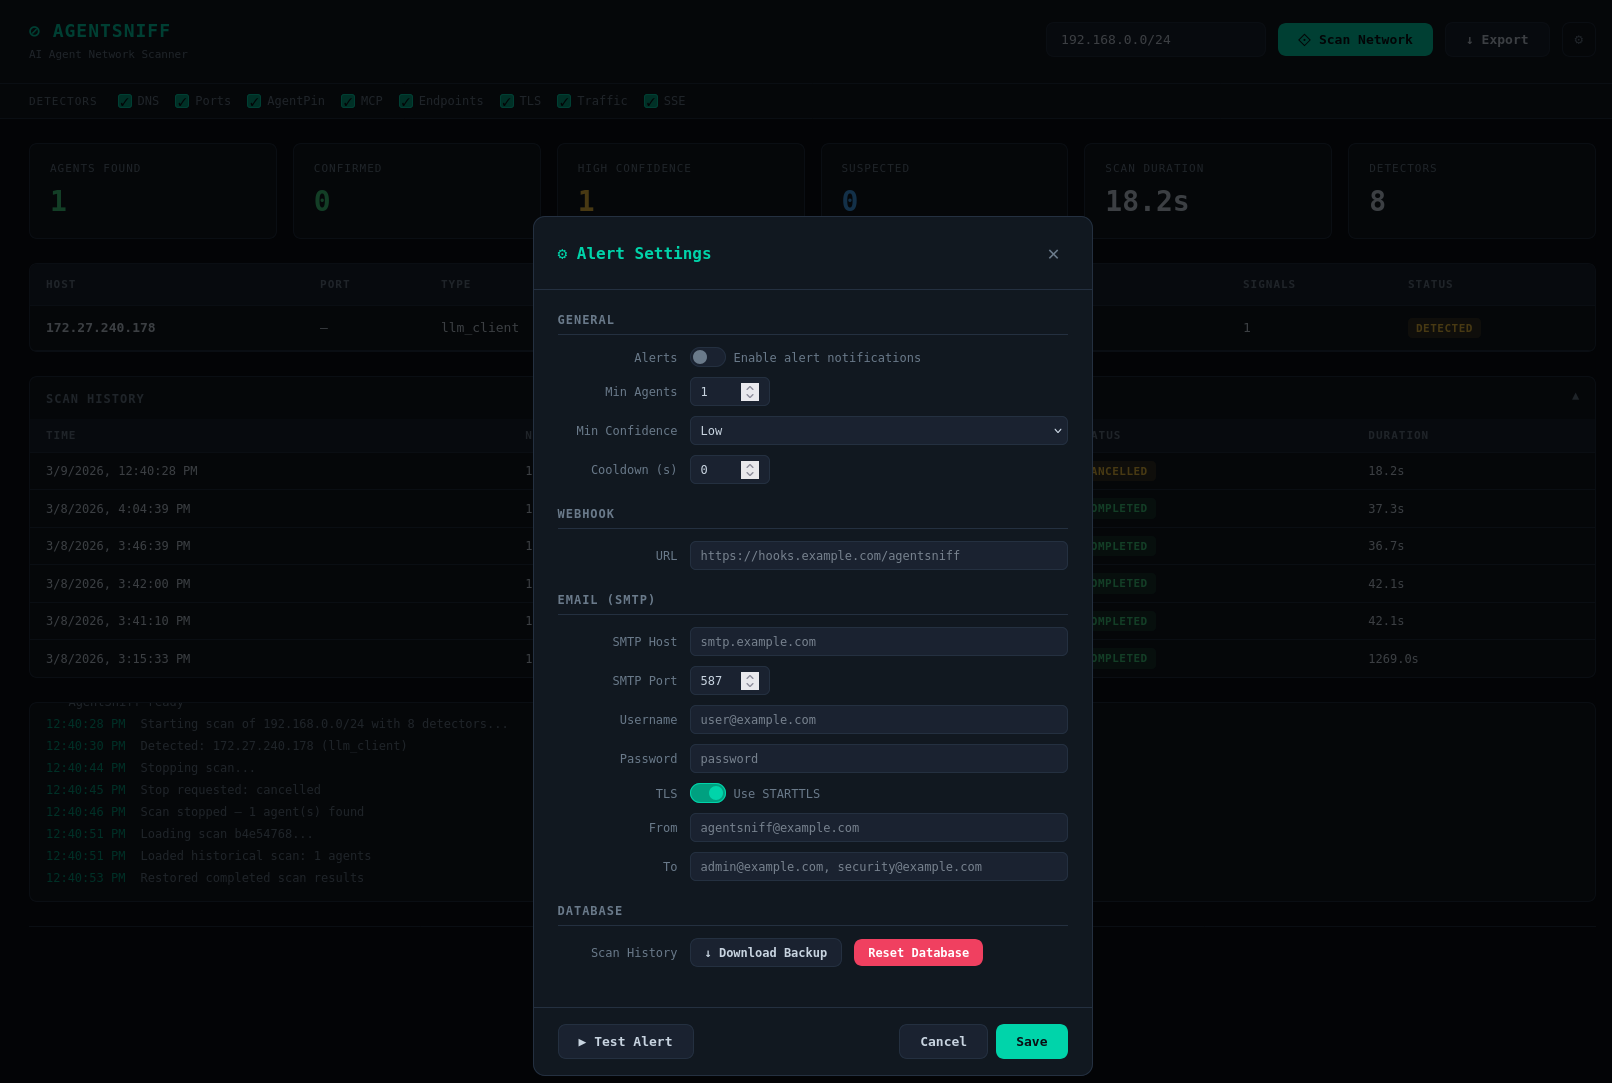
Settings
Click the gear icon to configure:
- Alert thresholds — Minimum agents and confidence level to trigger alerts
- Webhook URL — HTTP POST endpoint for alert notifications
- SMTP settings — Email server configuration for alert emails
- Test Alert — Send a test notification to verify configuration